

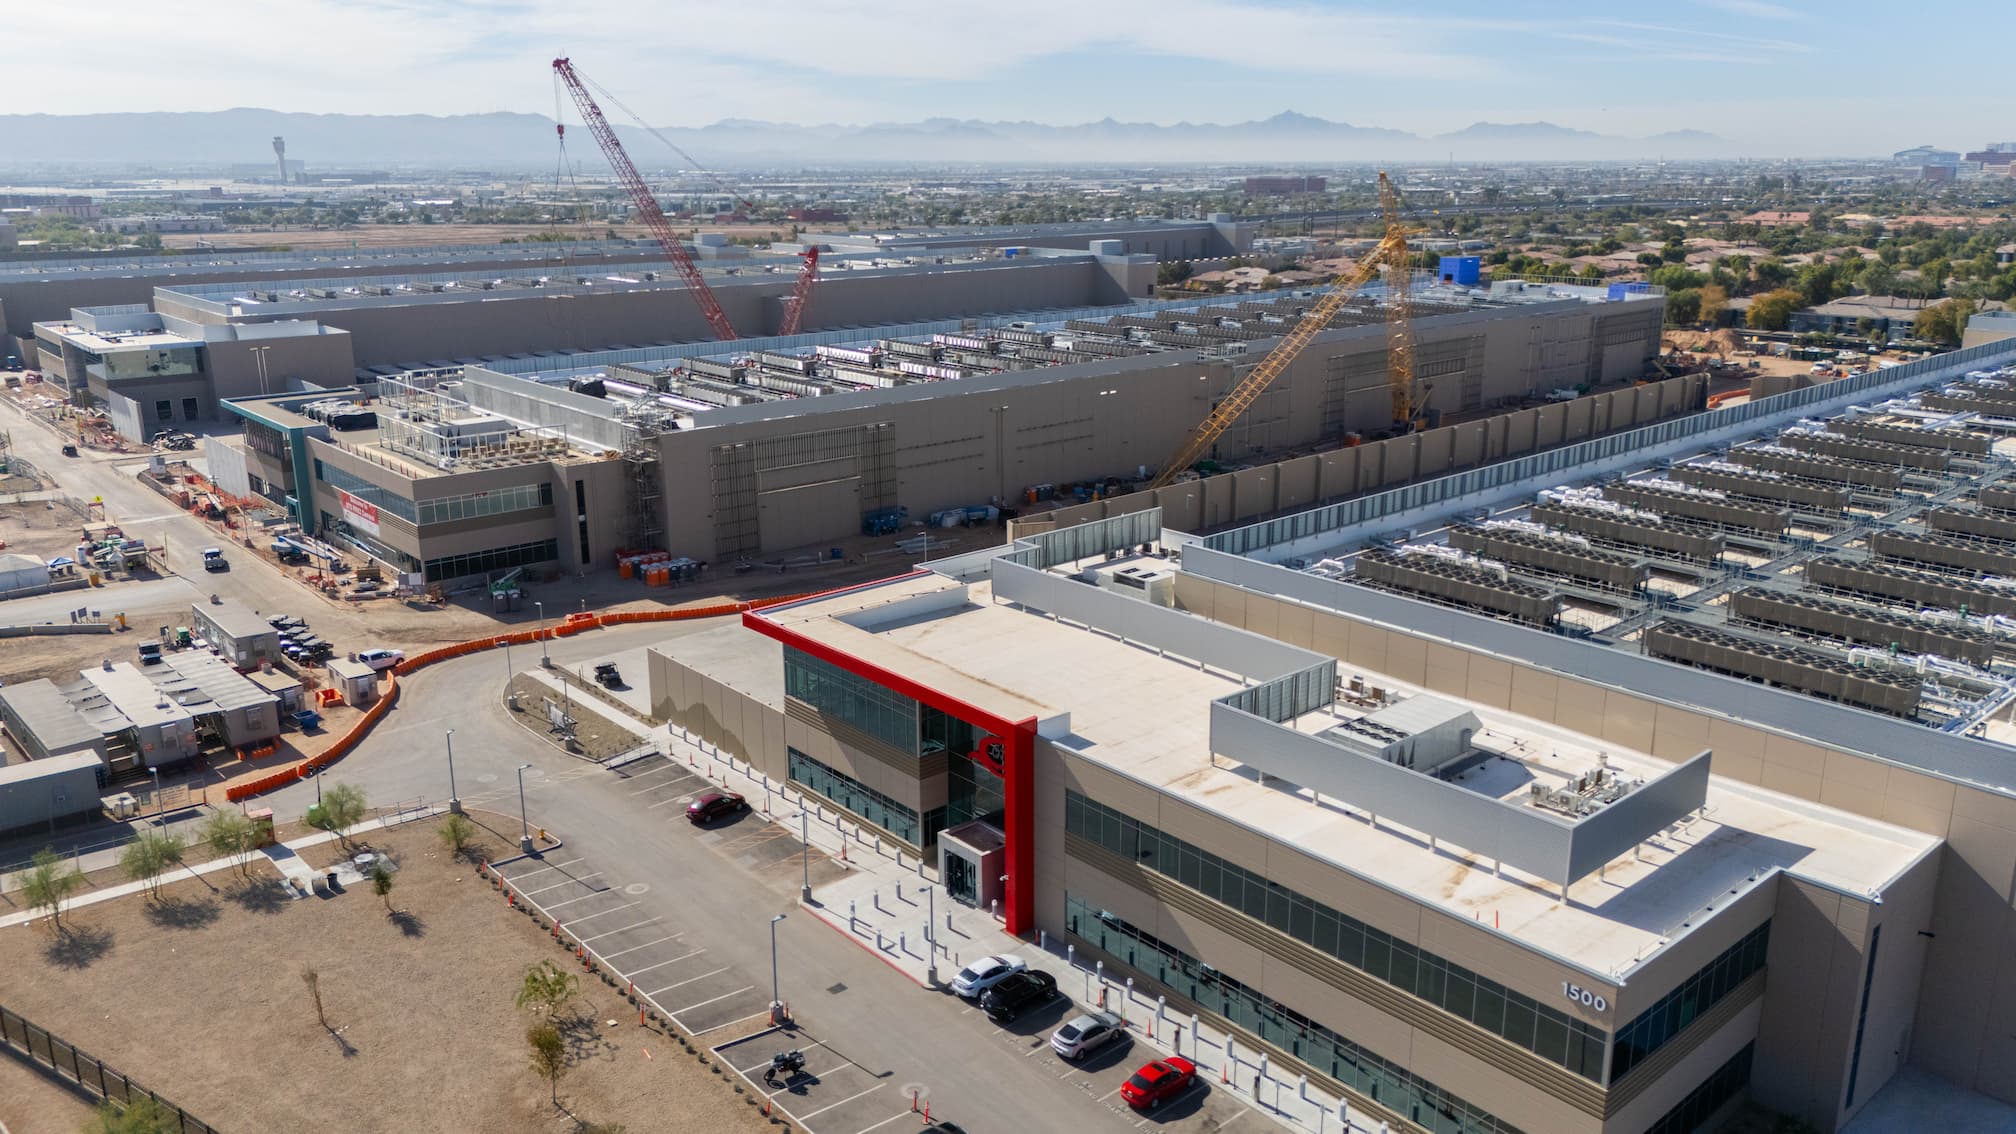
US factory output grew at its fastest quarterly pace in five years last quarter. One sector is doing most of the heavy lifting: chips and communications gear tied to the AI buildout.
Key Takeaways
- Manufacturing output grew at a 4.7% annualized rate in Q2 2026, the fastest quarterly pace in five years, per the Federal Reserve’s June G.17 report.
- Semiconductor production rose at a 10.2% annualized rate in Q2, more than double the broader manufacturing sector’s growth.
- Communications equipment output climbed at a 9.6% annualized clip in Q2, tracking continued AI infrastructure buildout.
- Manufacturing capacity utilization sits at 75.7%, still 3+ percentage points below its long-run average, meaning the growth is concentrated, not broad-based.
- Manufacturing accounts for roughly 9.4% of the total US economy, per the latest GDP data.
The Best Quarter for Factory Output in Five Years
The Federal Reserve’s mid-July industrial production report showed manufacturing output was flat in June. But it grew at a 4.7% annualized rate for Q2 overall, up sharply from 1.4% in Q1. That’s the fastest quarterly growth the sector has posted in five years. Total industrial production, which folds in mining and utilities alongside manufacturing, grew at a 4.0% annualized rate over the same period.
| Metric | Q1 2026 | Q2 2026 |
|---|---|---|
| Manufacturing output (annualized) | 1.4% | 4.7% |
| Total industrial production (annualized) | N/A | 4.0% |
| June monthly change (manufacturing) | Flat (0.0%) | |
Manufacturing has been treading water on hiring for nearly three years, per June’s ISM Manufacturing PMI report. A five-year-best output quarter is the kind of headline number that gets attention. The question is what’s actually behind it.
What’s Driving It: AI Infrastructure, Not a Broad Rebound
The growth isn’t evenly spread across the sector. It’s concentrated in a handful of product categories tied directly to AI infrastructure buildout.
| Category | Q2 2026 Growth (annualized) |
|---|---|
| Semiconductors | +10.2% |
| Communications equipment | +9.6% |
| Motor vehicles and parts (June, monthly) | +0.7% |
Semiconductor output grew more than twice as fast as manufacturing overall, a jump closely tied to the wave of new fab investment from chipmakers like TSMC expanding their US footprint. Communications equipment, the servers, networking gear, and data center hardware feeding AI buildouts, wasn’t far behind. Motor vehicles, by contrast, posted a modest 0.7% gain in June. That’s a reminder this isn’t a story about the auto sector, or manufacturing broadly. It’s a story about chips and data center infrastructure pulling the average up.
The Capacity Utilization Paradox
Here’s the part that should temper any read of this as a full industrial boom. Manufacturing capacity utilization, the share of factory capacity actually in use, sits at 75.7%. That’s essentially flat from May’s 75.8%, and still more than 3 percentage points below the sector’s 1972-2025 long-run average. Total industrial capacity utilization held at 76.1% for a third straight month.
In plain terms, US factories aren’t running flat out. If they were, rising output and high utilization would move together. Instead, output is climbing while a meaningful chunk of capacity nationwide still sits idle. That pattern points to targeted investment, more chip fabs, more server and networking equipment lines, not manufacturers broadly ramping up production across the board.
What This Means for Manufacturers
Manufacturing now accounts for roughly 9.4% of the total US economy, based on the latest available GDP breakdown. The sector is growing, but unevenly. Companies with a foot in semiconductors, data center hardware, or networking equipment are seeing real demand-driven expansion. Manufacturers outside that lane are watching from the sidelines, with utilization rates still below historical norms.
For plant leaders and operations executives, the practical takeaway is to watch where the capacity gap closes first. Segments tied to AI infrastructure are absorbing new investment now. Everything else is waiting on a broader capex cycle or clearer demand signals. IndustrialSage tracks that shift in real time on the US Manufacturing Investment Tracker.
Frequently Asked Questions
How much did US manufacturing output grow in Q2 2026?
Manufacturing output grew at a 4.7% annualized rate in Q2 2026, according to the Federal Reserve’s June industrial production report. That’s up from 1.4% in Q1 2026, and the fastest quarterly pace in five years.
What’s driving the growth in US factory output?
AI infrastructure spending is the main driver. Semiconductor production rose at a 10.2% annualized rate, and communications equipment output climbed 9.6% in Q2 2026, both far outpacing the rest of the manufacturing sector.
What is manufacturing capacity utilization right now?
Manufacturing capacity utilization was 75.7% in June 2026, down slightly from 75.8% in May. That’s more than 3 percentage points below the sector’s 1972-2025 long-run average.
Does high output growth mean factories are running at full capacity?
No. Capacity utilization remains below its historical average despite the strong output growth. The gains are concentrated in specific segments like semiconductors and communications equipment, not spread across the factory floor broadly.
How much of the US economy does manufacturing represent?
Manufacturing accounts for roughly 9.4% of the total US economy, based on the latest available value-added GDP data.
What was total industrial production growth in Q2 2026?
Total industrial production, which includes manufacturing, mining, and utilities, grew at a 4.0% annualized rate in Q2 2026.
Where can I track ongoing US manufacturing investment?
IndustrialSage maintains a US Manufacturing Investment Tracker that follows major announced investments, including those in semiconductors and AI infrastructure, in real time.

Author: Wes Garrett
Content and Growth Marketing Producer | From Strategy to Execution, Delivering Impactful Media Solutions and Client Success


